


NewYork-Presbyterian is one of the nation’s most comprehensive, integrated academic healthcare systems, dedicated to providing the highest quality, most compassionate care and service to patients in the New York metropolitan area, nationally, and around the world. In collaboration with two renowned medical schools, Weill Cornell Medicine and Columbia University Vagelos College of Physicians and Surgeons, NewYork-Presbyterian is consistently recognized as a leader in innovative, patient-centered clinical care, research and medical education.
NewYork-Presbyterian has four major divisions:
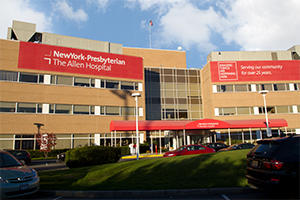
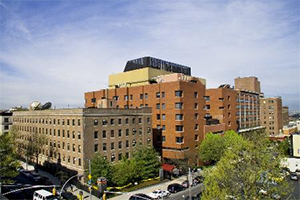
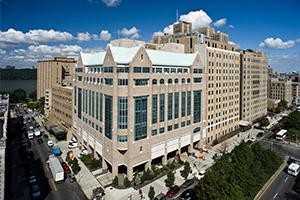
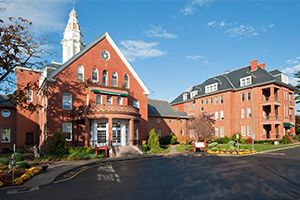
NewYork-Presbyterian Hospital
NewYork-Presbyterian Hospital is a world-class academic medical center committed to excellence in patient care, research, education, and community service. Based in New York City, it is one of the nation’s largest and most comprehensive hospitals and a leading provider of inpatient, ambulatory, and preventive care in all areas of medicine. With over 4,000 beds and more than 10,000 affiliated physicians and 50,000 employees, NewYork-Presbyterian sees more than 2 million visits annually, including close to 22,000 infant deliveries and more than 620,000 emergency department visits. NewYork-Presbyterian is comprised of eight campuses as follows:


NewYork-Presbyterian Regional Hospital Network
NewYork-Presbyterian Regional Hospital Network, comprised of leading regional hospitals in the New York metropolitan region, including:

NewYork-Presbyterian Medical Groups
NewYork-Presbyterian Medical Groups connect expert doctors with patients close to home to expand coordinated care and healthcare services across the regions we proudly serve. Our medical groups in Brooklyn, Queens, Westchester and Hudson Valley increase access to a wide range of primary and specialty care services, and include Weill Cornell Medicine and Columbia University Irving Medical Center physicians.
NewYork-Presbyterian Community and Population Health
NewYork-Presbyterian Community and Population Health, encompasses ambulatory care network sites and community health care initiatives, including NewYork Quality Care, the Accountable Care Organization jointly established by NewYork-Presbyterian, Weill Cornell Medicine, and Columbia University Vagelos College of Physicians and Surgeons.